Remote Sensing–ML Approach for Household Wealth Index Estimation
U.S. Census Bureau Emerging Technology (xD) Fellowship / SEHSD
In collaboration with the AI & Global Development Lab
Problem
The people most affected by economic policy are the least visible in the data used to design it.
Traditional small area estimation is unreliable below the block group level, carries substantial compliance overhead, and can take years to reflect conditions on the ground. This potentially stale and insufficiently granular data hits renters, low-income households, immigrant communities, and people in dense urban cores hardest. This leaves them folded into county averages that don’t represent them. As a result, the households most affected by economic policy are also the least visible in the data used to design it.
The Urban Institute’s Cost of Economic Security shows that families with seemingly adequate incomes may still fall short once housing, health care, child care, student debt, and savings are counted. That gap falls hardest on households with the least buffer—single parents, people managing care work, families one shock away from instability—but it can’t be resolved below the county or state level.
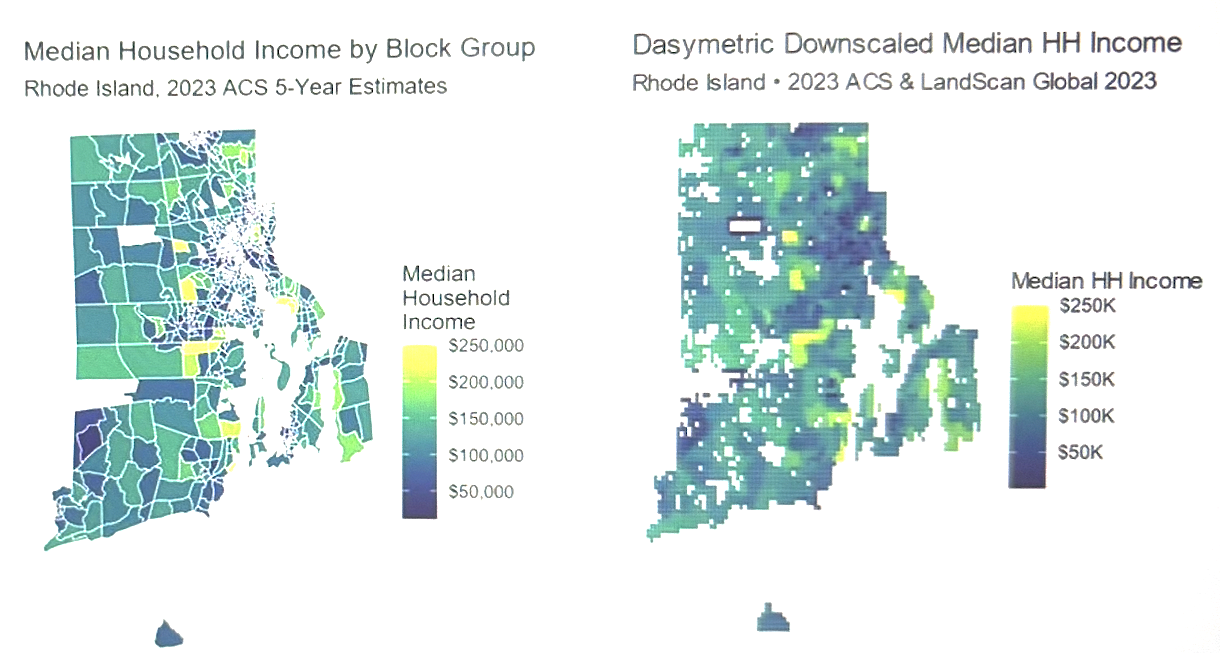
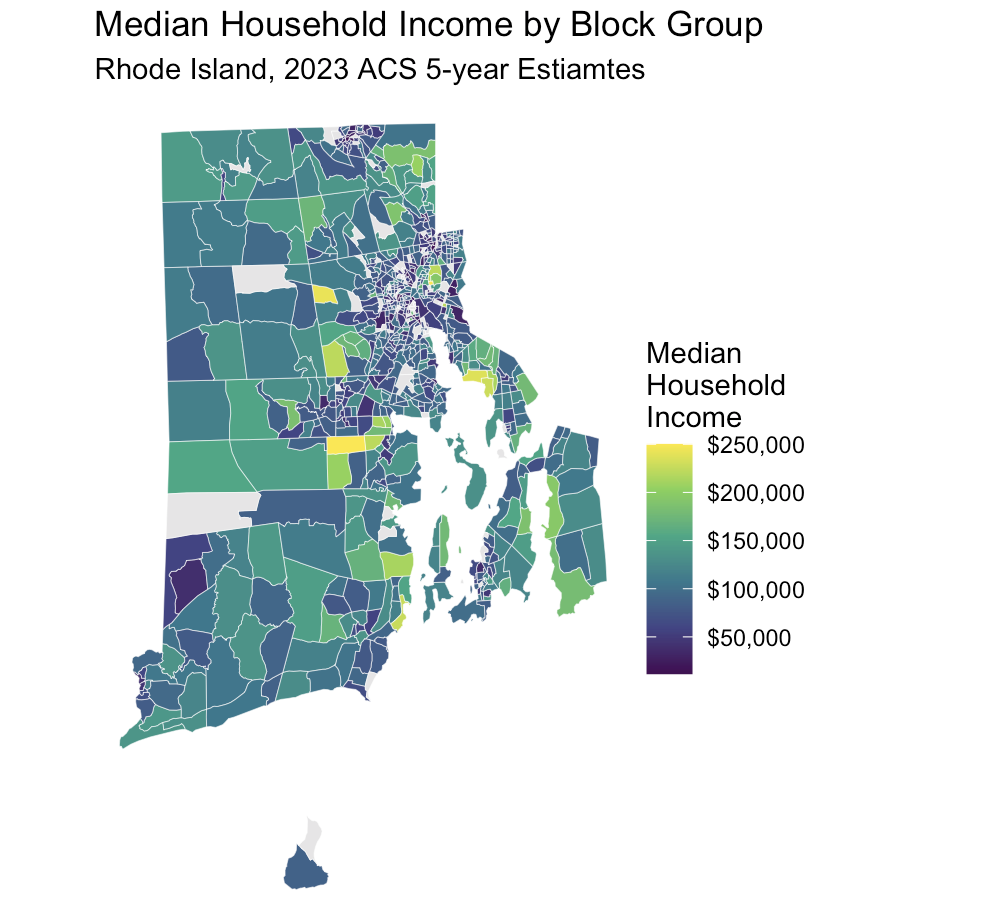
Rhode Island makes the stakes legible. Its 2023 ACS block group data shows urban cores around Providence below $100K, some blocks below $50K, while suburban and coastal areas reach $150K–$250K. A family in one of those blocks lives in a different economic reality than the county figure describes. So when resources get distributed by county, that family is funding-invisible.
The challenge is not economic apathy. Our measurement infrastructure resolves need at a scale where the most vulnerable disappear, so the problem is one of visibility rather than intent.
Solution
Observe economic development directly at the scale where people actually live to identify where need is concentrated, and target support more precisely at the neighborhood scale with a gap measure showing where households fall short of local cost of living.
Economic development leaves physical traces—construction and maintenance of housing, roads, farmland, and infrastructure—visible from orbit. A temporally aware model that tracks that development can estimate current wealth and trajectories, which matters most for neighborhoods in decline that no survey will register for years.
This project developed a geo-temporal EO-ML pipeline to predict average material wealth at the 1km grid level, aiming to identify where resource need is concentrated and guide support. The index is framed as a gap measure—income minus relative cost of living, using TCES or the Self-Sufficiency Standard—because for vulnerable households, absolute income is the wrong question. A neighborhood with rising incomes and faster-rising rents is losing ground, and only a gap measure will show it.
- Phase 1 (R): ground truth assembly and validated block group income visualization.
- Phase 2 (Python): model-ready inputs across three vintages (2013, 2018, 2023).
- Phase 3 (configured): GEE exporter ready to run against Landsat 5/7/8.
Disclosure risk was treated as a first-order design constraint using xD pre-mortem frameworks. A method resolving wealth to 1km cells can expose the same communities it aims to serve to predatory lending, discriminatory pricing, or enforcement targeting. Visibility is not automatically protective. The framework asks who benefits from being seen and who is endangered by it before the resolution question is settled.
Impact
Make need legible where it is actually experienced—without making people vulnerable in the process—so institutions can target support more precisely, using neighborhood-level gap estimates as the core ask. This keeps the goal focused while connecting measurement to action.
At 1km resolution, historical, present, and projected wealth estimates would help programs reach populations that county-level targeting currently misses, directing support where it is needed most.
- Program targeting that finds the low-income block inside a high-income county can direct resources where need is hidden, reaching households that fall through eligibility geographies.
- Disaster preparedness grounded in where material vulnerability concentrates can send evacuation, warning, and recovery resources to people with the fewest means to self-protect.
- Infrastructure and workforce planning informed by trajectory can let agencies intervene in neighborhoods trending downward before displacement arrives.
- Causal analysis of whether policies actually improved conditions can show, over time and at neighborhood scale, whether they reached the people they targeted.
The deeper impact is a shift in whose reality counts as data. Communities routinely undercounted or averaged away become legible to the institutions allocating resources, not as anecdote, but as evidence. That shift changes who can be served and sets up the governance questions that follow.
That legibility carries obligations. The open questions that matter most are institutional: what confidence interval is appropriate for official statistics, what consent and governance should attach to neighborhood-level wealth estimates, who has standing to contest an estimate about their own community, and how those disputes should be resolved. Clarify how these questions relate to power and accountability, and answer them with demographers, policy staff, and the communities being measured—not by r² alone. The deeper takeaway is that measurement only matters if institutions can govern it responsibly.
Stack & Methods
R (tidycensus, terra, sf, exactextractr, sfarrow, ggplot2, dplyr) · Python (pandas, numpy, ee, multiprocessing) · Google Earth Engine (Landsat 5/7/8) · LandSCAN Global · ACS 5-year estimates (B19013) · dasymetric downscaling · TCES / Self-Sufficiency Standard framing · LSTM / ResNet-18 (Daoud/Adel-Petterson) · Pearson’s r² · xD / Data & Society disclosure pre-mortem · Rhode Island PoC (11,926 cells; 2013/2018/2023)